SWIDEN AIRLINE
In the domain of business analysis, using tools like Power BI or Power Query in Excel often involves extracting information from different sheets in the same Excel file. Complexity arises when these sheets require adjustments before data integration. Unlike simple cases where all sheets share identical columns, more complex scenarios require a separate approach. To complete this challenge, follow these steps: Start by connecting to your Excel file in Power BI and select “Edit”. Create a query template using a sheet to establish the logic that applies to all others.
Eliminate unnecessary columns and perform essential transformations, ensuring that they will not reference missing columns in other sheets. Generate a function using parameters to generalize the process. Finally, invoke the function for each sheet and merge the data into a unified, refined table. Don't forget to define the data types for each column. These steps allow even novices to data analysis to effectively clean and consolidate data in Power BI.

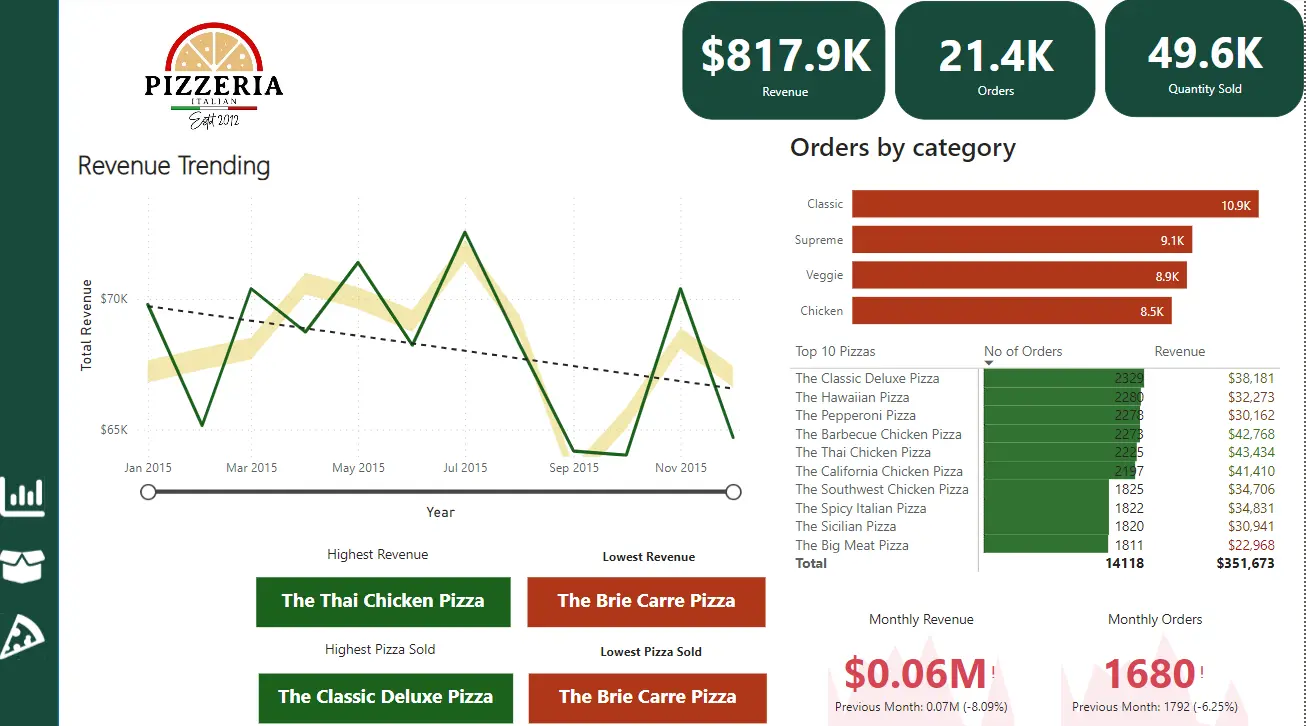
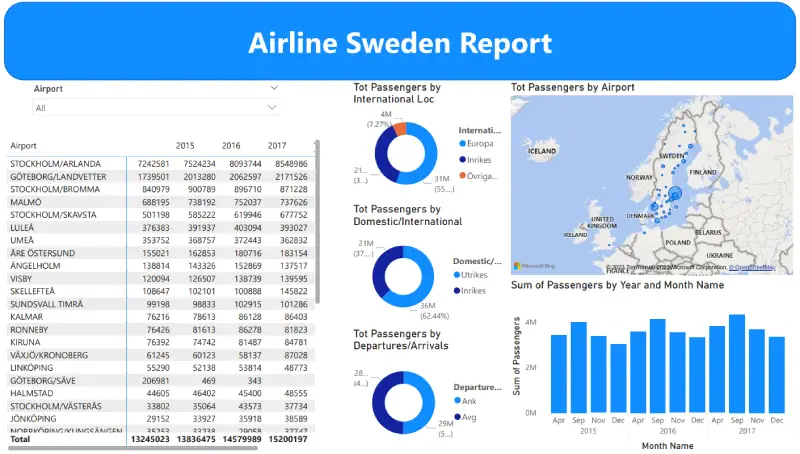
This dataset contains relevant passenger traffic information including departures and arrivals, airport details, year, location and date. Let's review the key information and make recommendations based on the available data.
Executive Summary: This report examines airline sales data in Sweden, providing comprehensive analysis of key trends and actionable insights. The main objective is to understand passenger trends over time, identify peak periods and recognize domestic and international flight trends. Passenger trends over time: Results: The overall trend in airline passenger numbers shows variations across months. The peak in passenger traffic was observed in September, suggesting potential seasonal influences.
Recommendations:
Adapt marketing strategies to align with seasonal fluctuations in passenger demand. Explore partnerships or collaborations during peak months to improve customer engagement. Domestic Flights and International Flights: Results: Domestic flights consistently show consistent demand throughout the year in Stockholm. International flights see notable spikes in specific months, indicating possible trends in tourism or business travel. Recommendations: Improve promotions on domestic flights for sustained engagement throughout the year. Capitalize on international travel trends by offering targeted promotions during peak months.

- Busiest airports and routes:
Results: Identify the busiest airports and routes based on passenger volume. Understand the popularity of certain destinations to optimize route planning. Recommendations: Streamline services and resources at high-traffic airports to improve the passenger experience. Assess the potential for expanding services on popular routes to meet growing demand.
Conclusion :
This analysis Airline sales data in Sweden reveals valuable insights into passenger trends, peak periods and route preferences. Implementing the recommendations described can help optimize services, improve customer satisfaction and ensure the success of the airline industry in Sweden.
#Swedish #Airline #Business #Analysis #Report